2019 Federal Budget Breakdown
Introduction
This is a Review of US Federal Government Budget. In it, the key concepts of the budget will be introduced (including the different classes of revenue and spending), the 2018 budget will be broken down and non-trivial categories illuminated, the exact composition of US Debt will be examined, and the Congressional Yearly Appropriations Process will be elucidated. Further, the President's 2019 Budget Proposal will be subsequently analyzed and his specific changes made clear. Finally, some conclusions will be drawn in the discussion where the current budget will be compared against historical precedence and where it will be examined and inferred what future the budget is leading us towards.
To begin, the Federal government has a revenue of $3.328 Trillion, spends $4.108 Trillion per year and has a deficit of $779 Billion. It holds a Total Debt of $21.4 Trillion, including an Intergovernmental Debt of $6.8 Trillion and a Public debt of $14.6 Trillion on which it pays an average 2.3% interest Rate ($325Billion). The percent of GDP which is paid to the Federal Government is 17.15%. With States Taxes it is 27.1% of GDP.
Relative to other countries, the US pays the 62nd highest percent of its GDP to its government. The Highest is Algeria and Finland at 64% and 54.8% respectively.
Given this overview, how exactly does the government get and spend it's money?
Important Definitions
Process by Which a Budget is Passed
Is the Entitlements/Appropriation Divide a Good Thing?
This is a Review of US Federal Government Budget. In it, the key concepts of the budget will be introduced (including the different classes of revenue and spending), the 2018 budget will be broken down and non-trivial categories illuminated, the exact composition of US Debt will be examined, and the Congressional Yearly Appropriations Process will be elucidated. Further, the President's 2019 Budget Proposal will be subsequently analyzed and his specific changes made clear. Finally, some conclusions will be drawn in the discussion where the current budget will be compared against historical precedence and where it will be examined and inferred what future the budget is leading us towards.
To begin, the Federal government has a revenue of $3.328 Trillion, spends $4.108 Trillion per year and has a deficit of $779 Billion. It holds a Total Debt of $21.4 Trillion, including an Intergovernmental Debt of $6.8 Trillion and a Public debt of $14.6 Trillion on which it pays an average 2.3% interest Rate ($325Billion). The percent of GDP which is paid to the Federal Government is 17.15%. With States Taxes it is 27.1% of GDP.
Relative to other countries, the US pays the 62nd highest percent of its GDP to its government. The Highest is Algeria and Finland at 64% and 54.8% respectively.
Given this overview, how exactly does the government get and spend it's money?
Important Definitions
- Mandatory Spending: Spending on pre-existing programs mandated by laws. Consistent of entitlement programs.
- Discretionary Spending: Spending that is who's amount is renewed and redetermined each year by the current President and Congress.
- Appropriations / Appropriation Bill: A law that authorizes expenditure for a specific purpose (Laws that determine Discretionary spending)
- Entitlements: Money given to individuals who qualify (disability, social security, medicare, food stamps, etc). Make up Mandatory Spending.
- PayGo
- Budget authority: The authority given (through laws) to agencies to receive and spend a specified amount of government money.
- Outlays: money spent
- House/Senate 12 Appropriations sub-Committees: reads over appropriations bills: Each subcommittee makes a budget resolution and makes a cap of discretionary spending using recommendations from their member agencies. It then passes this to the House/senate appropriations committee who then passes it to congress. Congress Votes on each subcommittee proposal
- Continuing Resolution: a resolution passed if the government has not completed the budget appropriation process (due September 30th) in order to temporarily fund the governments obligations until an agreement can be made.
- Omnibus: Usually, each subcommittee appropriation bill is passed individually. Omnibuses tie multiple Appropriation Bills together to be passed in a single congressional vote.
- Excise Tax: Taxes paid by the manufacturer when the goods are delivered to market. Distinct from Sales taxes which are levied at the point of sale, directly on the consumer
- Caps: Caps refer to the maximum limit that can be spent in the discretionary budget. It Arises from the Budget Control Act of 2011, passed during a debt crisis, as a mechanism for limiting federal spending. This act was also the one which increased the debt ceiling at the time.
- Public Debt: Debt issued by the federal government to non-federal government agencies such as individuals, corporations, the Federal reserve, etc
- Intergovernmental Debt: Interest-free debt that the federal government issues to other arms of the federal government, most notably the Social Security Trust Fund.
Analysis
Revenue
Total revenue
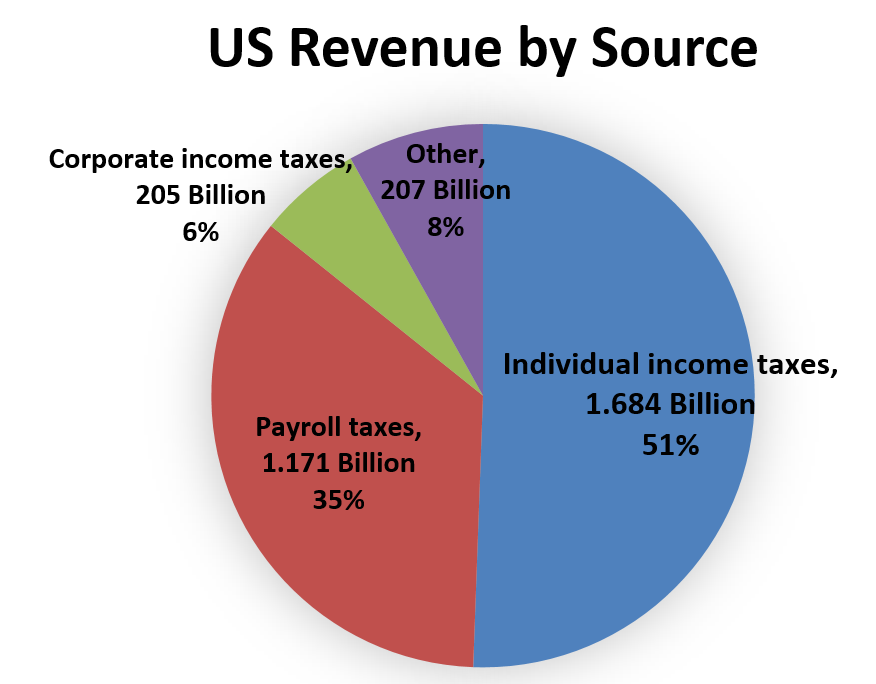
The Total Revenue of the US Government is 3.329 Trillion Dollars. The Following are the Major Sources of Federal Revenue in 2018:
 Therefore, the major Sources of revenue were Individual Income Taxes, Payroll Taxes, corporate Income Tax, and Other taxes (which include Excise Taxes, Sales Taxes, Estate Taxes and others).
Of this amount, 2.474 Trillion is "On-Budget Revenue" and $855 Billion is "Off Budget Revenue". Off budget revenue accounts for revenue generated from the Social Security Trust and the Postal Office.
The Change in Composition of Federal Revenue over time
The composition of the Federal Government Revenue has changed significantly over time (as seen below):
 From this, we can see the prior to the Great Depression Federal Revenue was funded roughly 40% by excise taxes and a further 30% by estate, duties, and other taxes. In modern times these two account for roughly 10% of federal revenue, representing a shift of importance to income and payroll taxes.
The Total Revenue of the US Government is 3.329 Trillion Dollars. The Following are the Major Sources of Federal Revenue in 2018:
Of this amount, 2.474 Trillion is "On-Budget Revenue" and $855 Billion is "Off Budget Revenue". Off budget revenue accounts for revenue generated from the Social Security Trust and the Postal Office.
The Change in Composition of Federal Revenue over time
The composition of the Federal Government Revenue has changed significantly over time (as seen below):

Spending
Total Spending:
Firstly, to understand Federal Spending, let us break down the major types of spending:
 Mandatory vs Discretionary Spending: As noted above, mandatory spending is spending that is mandated by laws already made (ie promises of spending already made). Discretionary Spending is the spending that the federal government allocates to each of its various agencies, which it changes and votes on every year.
Mandatory spending comprises mainly of health programs including Social Security, medicare, and medicaid. It is the spending that congress has already promised to pay out. It also includes "Other spending". The other spending, outlined below, mainly includes other health programs, Income security programs, retirement funds, and veterans programs.
 The Discretionary Budget, as mentioned, is the budget that the federal government determines each year to allocate to it's various branches. About half of this budget is allocated to defense spending and half to other discretionary spending (outlined below).
 It is in this 642 Billion dollar pool that most of the diverse functions of government is paid out from. That is, all Non-retirement (social security), Non-Healthcare, Non-Income security, and non-military budgets. In it we see funding for transportation, Education, community development, Justice, environment, and science/research funding.
In terms of Defense Spending, The Discretionary Military Budget is $622 Billion Dollars plus an additional 66 Billion from "Overseas Contingencies Operation", (outlined below) and an additional 6 billion dollars from "Other funding not constrained by Caps". This refers to "funding for emergencies, disaster relief, certain efforts to reduce overpayments in benefit programs, and certain activities designated in the 21st Century Cures Act (P.L. 114-255) is not constrained by the statutory caps established by the Budget Control Act of 2011 (P.L. 112-25)." (CBO Budget)
Total Spending:
Firstly, to understand Federal Spending, let us break down the major types of spending:

Mandatory spending comprises mainly of health programs including Social Security, medicare, and medicaid. It is the spending that congress has already promised to pay out. It also includes "Other spending". The other spending, outlined below, mainly includes other health programs, Income security programs, retirement funds, and veterans programs.


In terms of Defense Spending, The Discretionary Military Budget is $622 Billion Dollars plus an additional 66 Billion from "Overseas Contingencies Operation", (outlined below) and an additional 6 billion dollars from "Other funding not constrained by Caps". This refers to "funding for emergencies, disaster relief, certain efforts to reduce overpayments in benefit programs, and certain activities designated in the 21st Century Cures Act (P.L. 114-255) is not constrained by the statutory caps established by the Budget Control Act of 2011 (P.L. 112-25)." (CBO Budget)
Noteworthy Non-Trivial Spending
- Overseas Contingencies Operations: This category of spending includes $78Billion. $66Billion is allocated under Discretionary Defense spending and a further $12 Billion under Non-Military Discretionary Spending. It is also known as a "War Fund" and was created after 9/11 to bolster spending for the Wars in Iraq and Afghanistan. However, the fund continues to exist even as US troop deployments abroad have reached historic lows. Further, these $78 Billion are equivalent to over 10% of Department of Defense Spending and roughly 3/4 of Education Spending. It is roughly double what is spent on the NIH and NSF combined (40Billion).

- Fannie Mae and Freddie Mac: Fannie Mae and Freddie Mac is a sub-department of the Federal Housing Finance Agency that provides liquidity to lenders which provide mortgages. It does so by buying mortgages from lenders, giving the lenders liquidity to subsequently lend to new home buyers. In this way it helps lubricate and stabilize the housing market. It is part of Mandatory Spending and outlays 4Billion/year. Purchases made by Fannie MAe and Freddie Mac have been backed by the US treasury since the 2008 Recession in order to assure the solvency of the agency and faith in the market.
- Health Services and Research: the "general science, Space, and Technology" and "health" outlays account for nearly all funding for research for programs like NIH (37 Billion), CDC (12 Billion),, FDA (5.6 Billion), in addition to administrative coasts for medicaid. In total, 130 Billion is spent on Health services and Research.
- Science, Environment, Energy: 71 Billion Dollars is spent on this. Half of this is spent on the EPA (8 Billion) and other conservation effort while a quarter is spent on NASA (20 Billion). The rest is spent on the NSF (6.6 Billion), and the Department of energy.

Debt
The National Debt as of January 2019 is 21.4 Trillion Dollars. However, of this amount, only 14.6 Trillion Dollars is held by the Public. In this sense, the public includes Treasury securities held by entities outside of the Federal Government (such as individuals, states, foreign states, corporations, the Federal reserve system, etc). This means that $6.8 Trillion Dollars is held by agencies of the federal government such as the Social Security Trust Fund.
Of the $14.6 Trillion of Public Debt, the United states has an average Interest Rate of 2.3% and thus outlays $325Billion in Interest. This accounts for 6.8% of Total Spending.

Of the $14.6 Trillion of Public Debt, the United states has an average Interest Rate of 2.3% and thus outlays $325Billion in Interest. This accounts for 6.8% of Total Spending.

Process by Which a Budget is Passed
- Click HERE for a great summary on the Budgetary Approval Process
Discussion (To be continued)
How Significant are Non-military Discretionary Spending?
What Percent of the Federal Government is Funded by each tax Bracket?


Notes on the lack of Environmental Focus Representation in the Federal Budget
Is the Military Budget too Big? too Small? What does that money go to?
Are we paying too much in Mandatory Outlays?
Are we paying too much in Mandatory Outlays?
Sources
- https://www.federalbudgetinpictures.com/
- https://docs.google.com/uc?export=download&id=no
- https://www.fhfa.gov/SupervisionRegulation/FannieMaeandFreddieMac/Pages/About-Fannie-Mae---Freddie-Mac.aspx
- https://www.cbpp.org/research/federal-budget/policy-basics-non-defense-discretionary-programs
- Congressional Budget Office, January 2019 Budget
- https://www.cbpp.org/research/federal-budget/policy-basics-non-defense-discretionary-programs
- https://www.thebalance.com/current-us-discretionary-federal-budget-and-spending-3306308
- https://en.wikipedia.org/wiki/National_debt_of_the_United_States
Comments
Post a Comment